Floki Inu: Technical Analysis
Dive into a thorough technical analysis of Floki Inu on the 4H timeframe, where indicators such as Volume, Parabolic SAR, and MACD signal bullish momentum, yet overbought conditions from RSI and Stochastic Oscillator warrant caution. Discover insights on potential future movements of this trending asset.
10/22/20231 min read

Technical Indicators:
Volume: The current volume stands at 216.172B, indicating a substantial trading activity surrounding the asset.
Parabolic SAR: The Parabolic SAR reads 0.00001928, suggesting the asset is currently in an uptrend.
SMA: With a moving average of 0.00002116, the price is currently above the SMA, reinforcing the bullish sentiment.
Ichimoku: No specific values provided, but it’s an essential indicator to track for potential crossover points.
Bollinger Bands: The price currently resides closer to the upper band, signaling potential overbought conditions. The bands' values are:
Stochastic Oscillator: At %K 92.49 and %D 93.48, the oscillator is in the overbought territory, hinting at a potential pullback.
RSI: Currently sitting at 88.79, the RSI further indicates overbought conditions.
On Balance Volume: A robust 5.251T, showcasing strong buying pressure.
MACD: The MACD line stands at 0.0000144 and the signal line at 0.0000067. The histogram reading of 0.00000077 suggests the bullish momentum is continuing but be cautious of potential crossovers which might indicate trend reversals.
Overall Analysis & Most Probable Scenario:
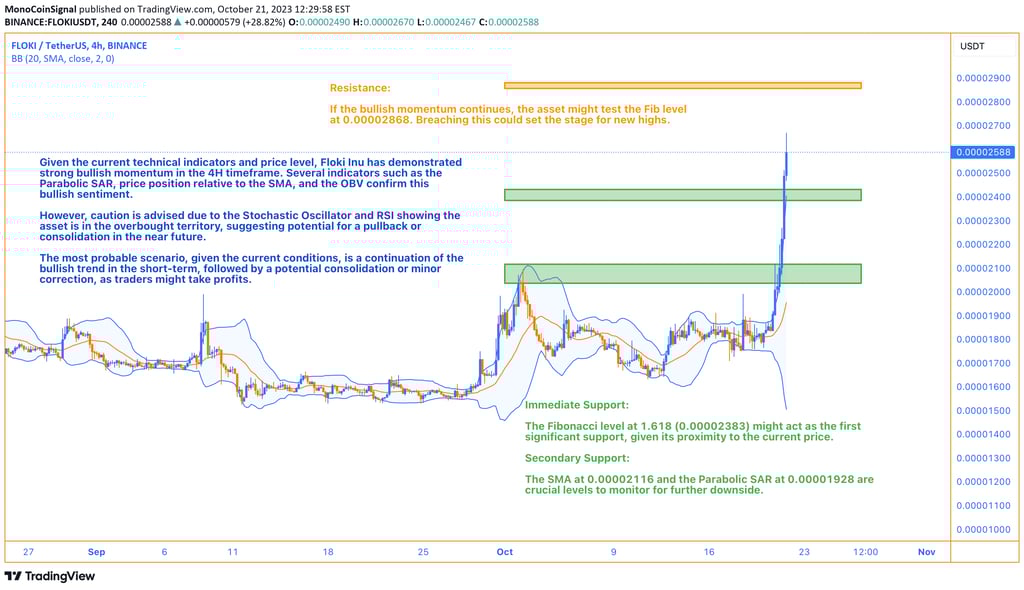
Given the current technical indicators and price level, Floki Inu has demonstrated strong bullish momentum in the 4H timeframe. Several indicators such as the Parabolic SAR, price position relative to the SMA, and the OBV confirm this bullish sentiment.
However, caution is advised due to the Stochastic Oscillator and RSI showing the asset is in the overbought territory, suggesting potential for a pullback or consolidation in the near future.
The most probable scenario, given the current conditions, is a continuation of the bullish trend in the short-term, followed by a potential consolidation or minor correction, as traders might take profits.
Conclusion:
Floki Inu on the 4H timeframe demonstrates strong bullish momentum, confirmed by several technical indicators. However, with overbought readings on both the Stochastic Oscillator and RSI, there's potential for a pullback or consolidation.
Note: This analysis is based on the provided data by indicators and is for informational purposes only. Trading cryptocurrencies is risky; always do your own research and consult with a financial advisor before making investment decisions.