EURUSD: Bearish Momentum
EUR/USD, trading at 1.07306 in the 4-hour timeframe, hovers near the lower Bollinger Band, suggesting a potential for correction towards the mean at 1.07511. The RSI at 44 indicates bearish momentum, while the MACD, below the signal line, suggests potential waning of the downward momentum. The market leans towards a short-term bearish bias, yet proximity to key Fibonacci retracement levels and the lower Bollinger Band hints at possible support, anticipating a consolidation phase before a clearer direction is established.
2/14/20241 min read
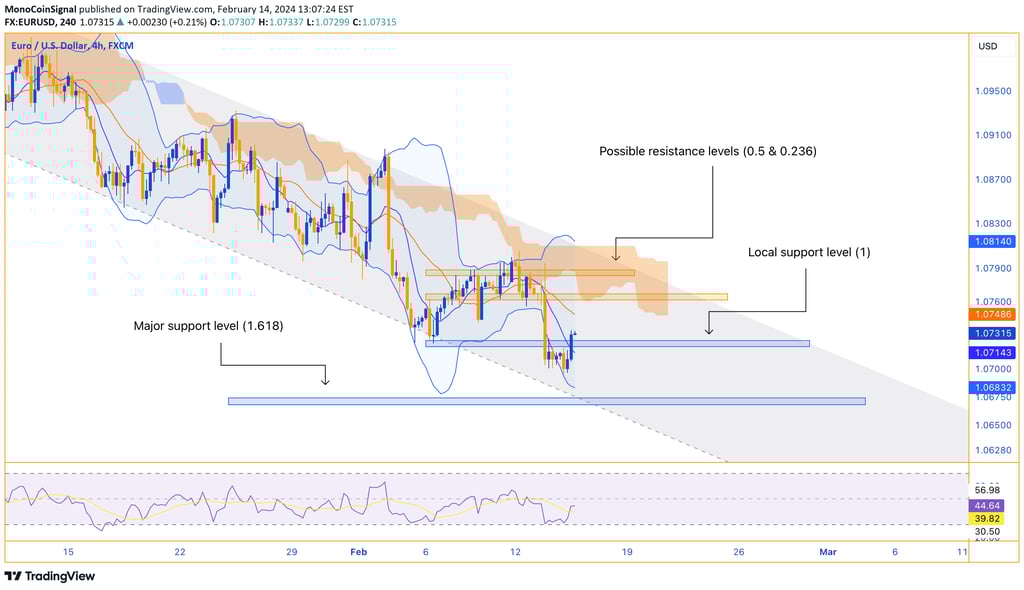

The EUR/USD pair is currently trading at 1.07306, maneuvering near the lower Bollinger Band in a 4-hour time frame, which often suggests the market could be nearing an oversold condition and might anticipate a corrective move towards the mean, represented by the middle Bollinger Band at 1.07511. The RSI at 44 signifies a bearish momentum, yet not strong enough to indicate an oversold market, which aligns with the MACD that is below the signal line, suggesting bearishness but with a histogram value close to zero, hinting at potential waning of the downward momentum.
The market's current posture, when assessed with the given indicators, seems to lean towards a bearish bias in the short term. However, the proximity of key Fibonacci retracement levels and the lower Bollinger Band could potentially provide support and a platform for a price rebound. This scenario points to a consolidation phase where the pair might fluctuate between these bounds before establishing a clearer direction.