Ethereum's Price Range and Potential Trend Shift
Ethereum's price is range-bound between $1600 and $1700, facing dynamic and static resistances. Within shorter timeframes, the price oscillates between $1690 and $1650. Learn about potential breakouts and the prudent approach to monitor the market for medium-term trend shifts.
8/20/20231 min read

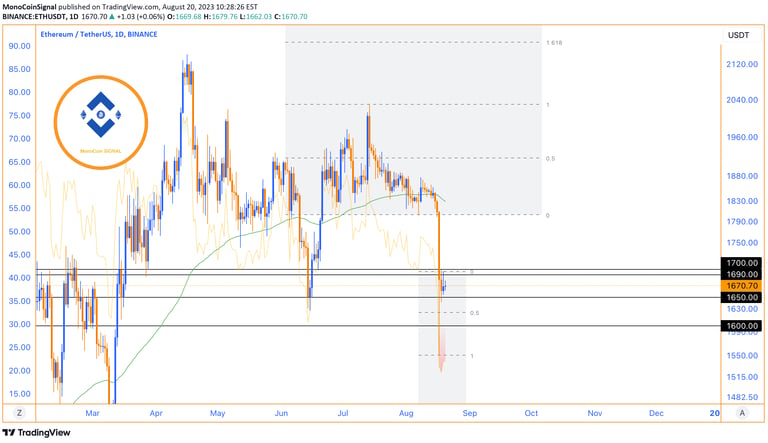
Ethereum's price chart, spanning the $1600 to $1700 range, encounters several dynamic and static resistance points, creating the potential for a range-bound trend within these levels. Furthermore, within shorter timeframes, Ethereum's current trend oscillates between $1690 and $1650.
A substantial breakout from this price channel could potentially trigger a significant price movement, either in an upward or downward direction, corresponding to the height of the channel. Given this scenario, a prudent approach for the medium term involves monitoring the market for signs of a potential shift in trend.
In simpler terms, Ethereum's price is currently moving between $1600 and $1700, facing multiple resistance points. This might result in a sideways movement for some time. Also, in shorter timeframes, Ethereum's price is moving between $1690 and $1650. If the price breaks out strongly from this range, it could either rise or fall significantly, by a distance similar to the channel's height. As a result, it's wise to keep an eye out for signs indicating a potential change in trend for the medium term.