Ethereum's Market Resilience
Analyze Ethereum's recent market resilience and potential upward trajectory. Explore key support and resistance levels, providing insights for strategic trading decisions.
12/14/20231 min read
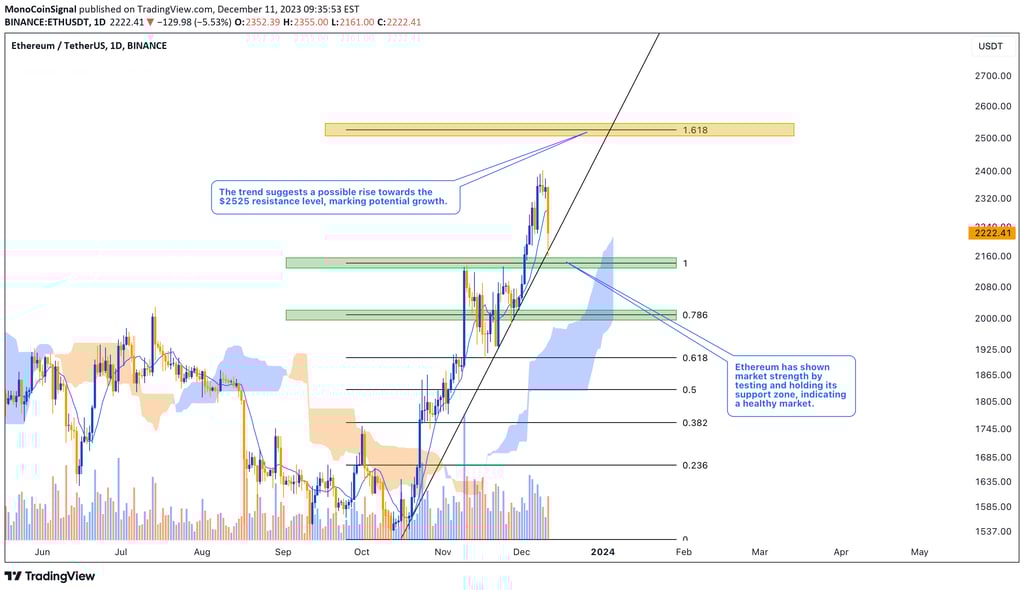
The Ethereum, as anticipated, demonstrated its market resilience by testing its support zone and attracting liquidity from that area.
This positive trend, bolstered by the current support, suggests a continued upward trajectory towards the $2525 resistance level.
Currently, the support zone is identified between $2010 and $2142, playing a crucial role in sustaining the current trend and preventing further price declines.
On the flip side, the $2525 mark stands as a significant resistance level, where surpassing it could lead to a substantial increase in Ethereum's market price.
This analysis is for informational purposes only and should not be considered as financial advice.