Ethereum: Testing Key Resistance
Explore Ethereum's current bullish trajectory within a defined channel, backed by positive MACD signals. Attention to potential challenges near the upper Bollinger Band at $3173.78 is crucial, with the RSI indicating overbought conditions. Traders should monitor for signs of a weakening trend, keeping an eye on support levels, including the lower Bollinger Band at $2930.87 and the Simple Moving Average (SMA) at $3092.55.
2/27/20241 min read
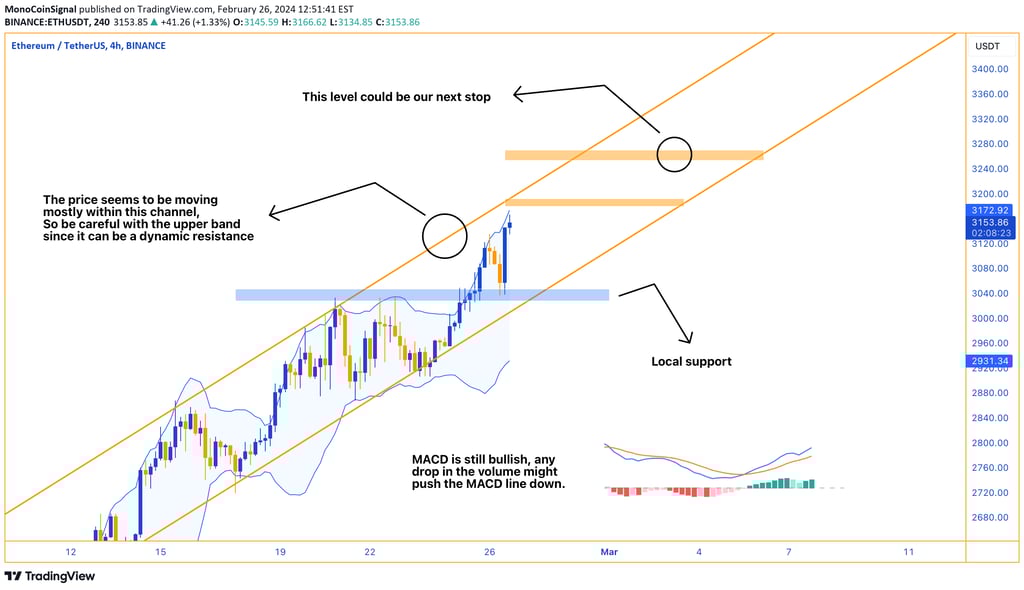
Ethereum is currently trading within a bullish channel, maintaining a steady climb above its local support levels. The MACD indicates a bullish trend with the histogram in positive territory, reinforcing the upward momentum. However, traders should watch for any volume decline, which may signal a weakening of the current trend and a potential pullback.
The upper Bollinger Band, positioned at $3173.78, could pose a challenge as ETH approaches. A decisive breakout above this level could pave the way for further gains, while any reversal here might suggest a short-term retracement.
The RSI is relatively high at 71.49, suggesting that ETH is in the overbought zone, which traditionally calls for caution among traders. Should a correction occur, the lower Bollinger Band at $2930.87 and the Simple Moving Average (SMA) at $3092.55 stand out as key support zones.