ENJ's Potential Fakeout
ENJ forms a small triangle pattern while attempting to break below the uptrend channel. Key resistance levels are at $0.3560 and $0.37, with support around $0.3370. Monitor closely for a potential 'fakeout' in the overall bullish market.
5/28/20241 min read
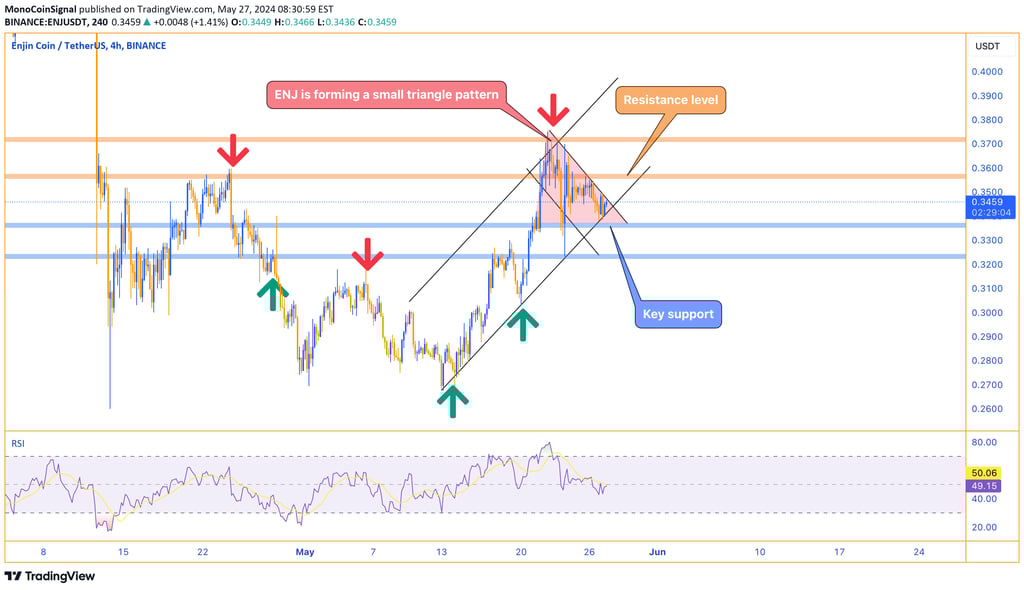

ENJ is currently forming a small triangle pattern and is attempting to break below the uptrend channel. The key resistance levels to watch are at $0.3560 and subsequently at $0.37. On the downside, the support level is around the $0.3370 area, with the current price hovering around $0.3460. Given the overall bullish sentiment in the market, this potential breakdown might turn out to be a false move, commonly referred to as a "fakeout." It is important to closely monitor the price action to confirm whether this breakdown sustains or reverses within the broader bullish trend.