Downward Trend and Price Dynamics
Monero's consistent decline sees it at $136, within the range where its last upward movement began. With 9 consecutive bearish weekly candles, a decisive break above $149 is needed for a potential shift toward $200.
9/3/20231 min read
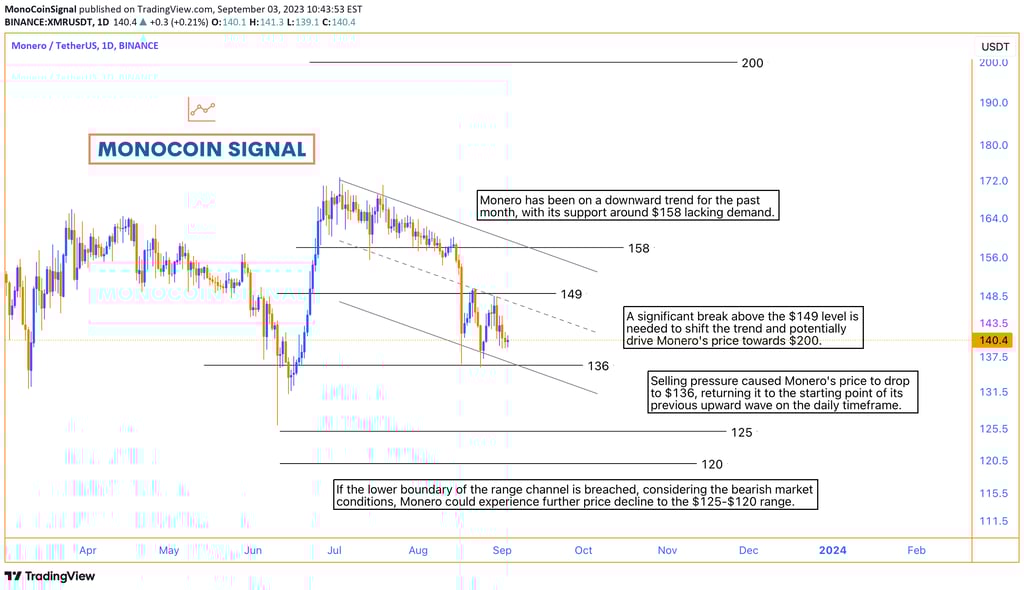
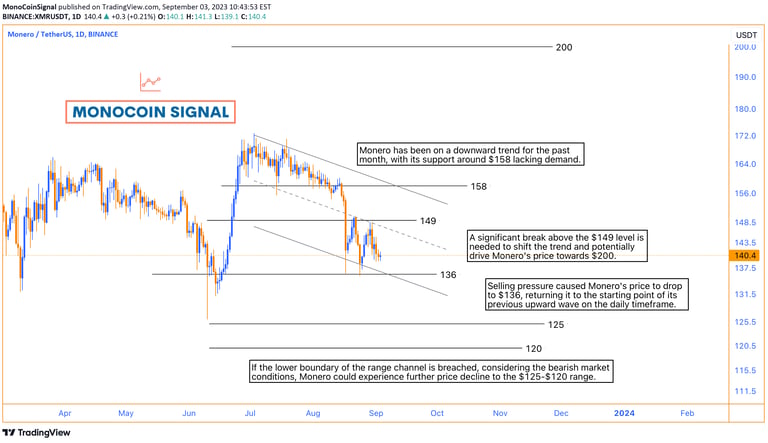
Monero has experienced a consistent decline over the past month. Despite considering a support level around $158, there wasn't enough demand to maintain it. This coincided with increased selling pressure, causing Monero's price to drop to around $136. This puts the currency back into the range where its previous upward movement began, as seen in the daily timeframe. Looking at the weekly timeframe, there have been 9 consecutive bearish candles, indicating significant selling pressure. To change this negative trend, a decisive break above the $149 level is necessary, which could lead to potential price growth towards the target of $200.
In the short term, the price chart displays a channel between $150 and $135. If the lower boundary of this channel is breached, considering the overall bearish market conditions, there's a possibility of further price decline towards the $125-$120 range for Monero (XMR).