Downward Risk For Monero
XMR breaks out of a long-term downtrend, fluctuating within a specific range. Potential breakout could lead to a change in price by the width of the rectangle. Watch for strong bearish patterns signaling a potential decrease to the green line area.
4/22/20241 min read
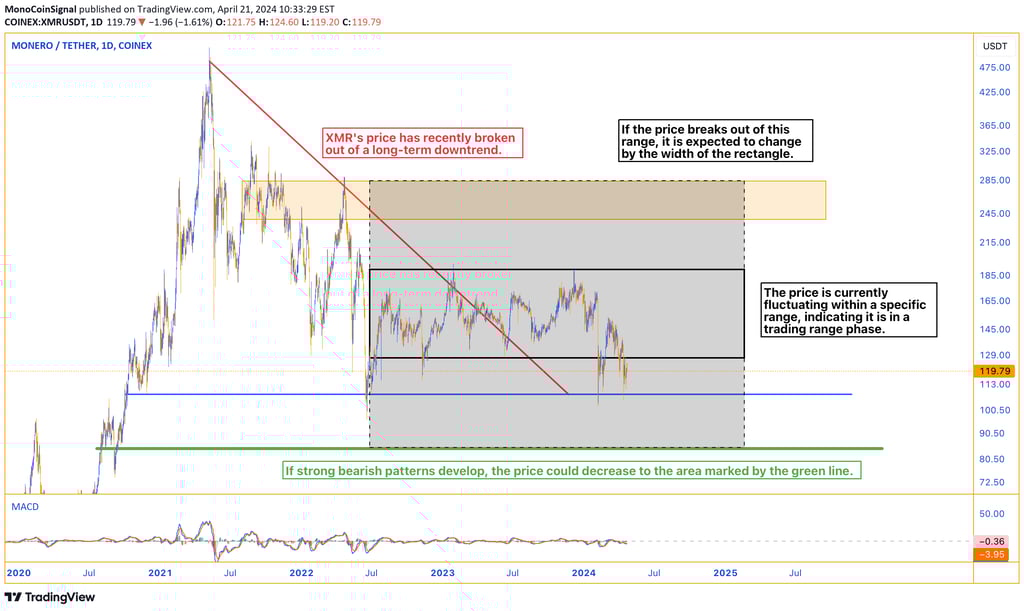

The price of XMR has recently broken out of a long-term downtrend and exited this pattern. Currently, the price is fluctuating within a specific range and is in a trading range phase. If the price breaks out of this range, it is expected to change by the width of the rectangle. Additionally, if strong bearish patterns form, the price may decrease to the area of the green line.