$139 Resistance Struggle
Explore QNT's weekly chart as it attempts to break the $139 resistance, currently trading between $139 and $84. Potential retest at $84 and a future break above $139 could signal an upward move.
1/10/20241 min read
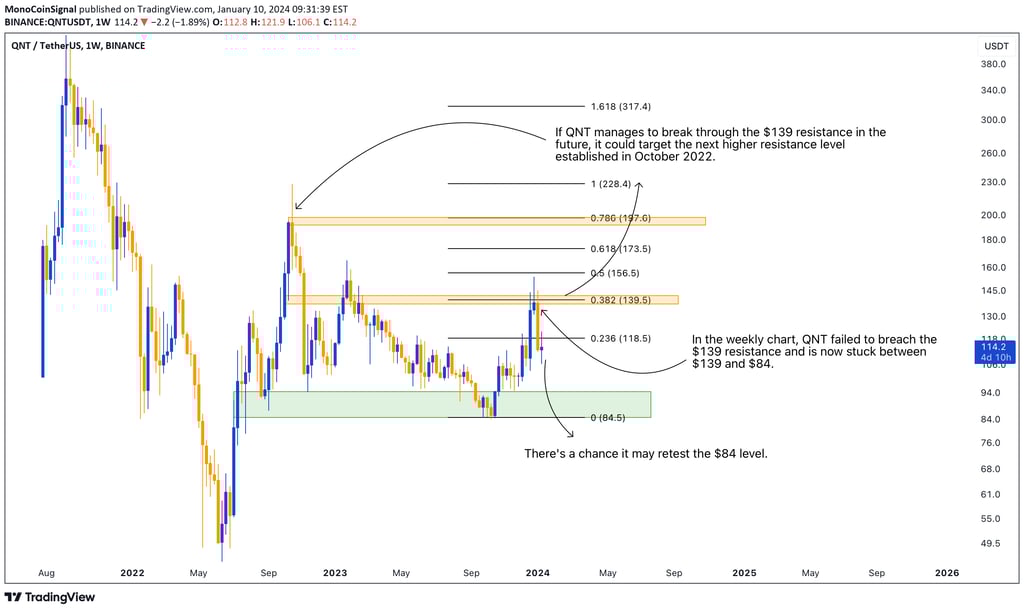
n the weekly chart, QNT attempted to surpass its $139 resistance but couldn't, currently trading between $139 and $84. A retest of $84 is possible. A future break above $139 may lead to a move toward the next higher resistance established in October 2022.