DOGE Eyes Key Level
Dogecoin is currently priced at $0.1757, showing a downward movement on the 4-hour chart. Technical indicators like MACD, Stochastic Oscillator, and RSI suggest a potential rebound if the price holds above a strong support level. Traders monitor this level closely to gauge Dogecoin's direction in the coming days.
4/6/20241 min read
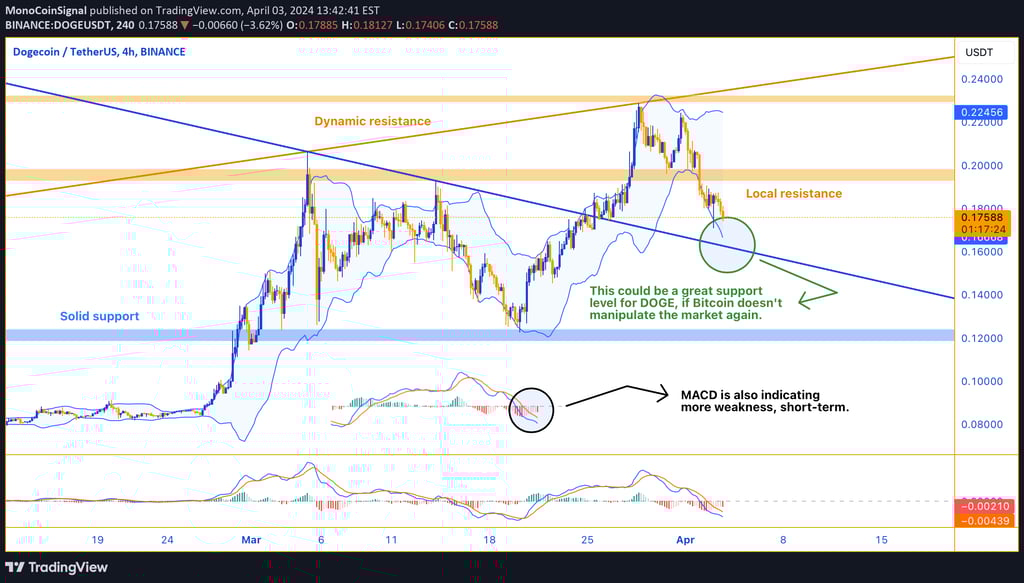
Dogecoin is currently priced at $0.1757, showing a downward movement on the 4-hour chart. The price is close to what might be a strong support level, a price where Dogecoin has previously found a steady footing. If the price can hold at this level, it might be a good sign for Dogecoin, potentially leading to a rebound. However, if the price falls below this point, it could indicate that Dogecoin might see further drops.
The technical indicators are suggesting that the price is leaning toward the lower side for now. The MACD, an indicator that helps show the momentum and trend of the price, is below the signal line, which generally means the price is currently on a downward trend. The Stochastic Oscillator is very low, which typically suggests that the price might start to go up again, as it may be considered undervalued at this point. Lastly, the RSI, another momentum indicator, is also quite low, supporting the possibility of an upcoming increase in price if buyers step in.
In simple terms, Dogecoin is at a point where it might start to pick up again if it keeps above the current support level. Traders might be watching to see if it can stay above this level or if it will drop further. The coming days will be crucial to determine which way it will go.