Descending Triangle Pattern
Quant (QNT) forms a descending triangle pattern, testing resistance level A after fluctuating between support level A and resistance level B. Breaking these resistance levels could initiate an upward price trajectory.
3/14/20241 min read
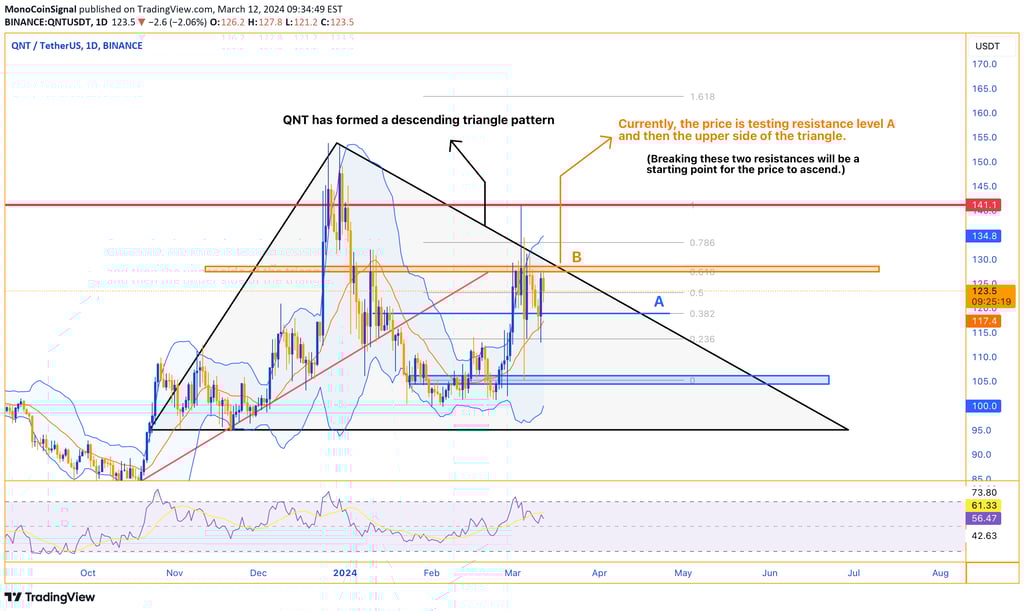
QNT has developed a descending triangle pattern following its fluctuation between support level A and resistance level B. Presently, the price is undergoing a test of resistance level A, subsequently targeting the upper boundary of the triangle. Overcoming these two resistance levels will serve as a critical initiation for the upward trajectory of the price.