Decisive Price Movement Ahead
Explore Bitcoin's current triangular pattern on the 4-hour timeframe, signaling a consolidation phase with potential for a significant price movement. Key resistance at $44,500 and vital support levels discussed.
12/17/20231 min read
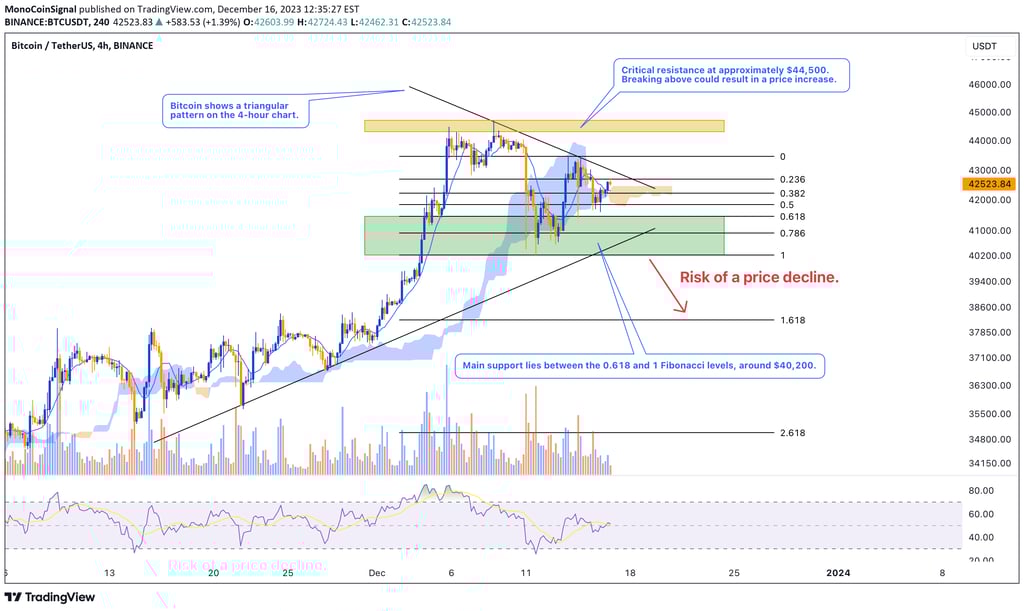
Bitcoin has formed a triangular pattern in the 4-hour time frame, which is of significant interest to technical analysts. This pattern indicates a consolidation period that typically leads to a substantial price movement. The key resistance level is at around $44,500, and breaking this level could lead to a price increase. On the other hand, the main support is observed between the 0.618 and 1 Fibonacci levels (approximately $40,200). If Bitcoin fails to maintain this support level and breaks the lower edge of the triangle, we might witness a price drop.