Critical Fibonacci Levels
STX faces substantial resistance at $1.1940, leading to a decline below the pivotal support zone of $0.9670. The price is currently oscillating between 0 and 0.236 Fibonacci retracement levels, indicating a potential retracement from its recent peak. Traders should monitor this key zone for potential reversals or a continuation of the downtrend.
12/10/20231 min read
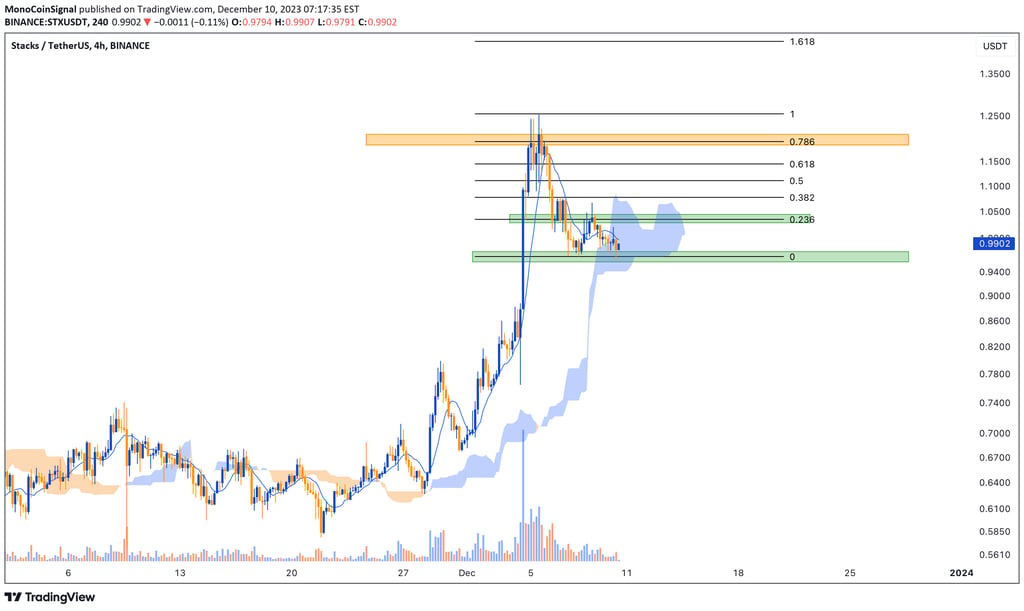
STX has experienced a substantial resistance at the crucial $1.1940 level, leading to a decline below the pivotal support zone of $0.9670.
Currently, the price is oscillating between the 0 and 0.236 Fibonacci retracement levels on the four-hour chart. This positioning suggests that the price is in the initial phase of retracement from its recent peak.
The area between these levels often acts as a key zone for potential reversals or continuation of the trend. If the price manages to breach this zone and sustains above it, it could indicate a shift in market sentiment, potentially leading to an uptrend.
Conversely, failure to break above the 0.236 level might result in a continuation of the downtrend.