Critical Decision Point
Theta is trading near critical levels on the 4-hour chart, with resistance at $2.57 and pivotal support around $2.29. Watch for significant movements based on the next few candlesticks to determine the potential bullish or bearish trend.
5/27/20241 min read
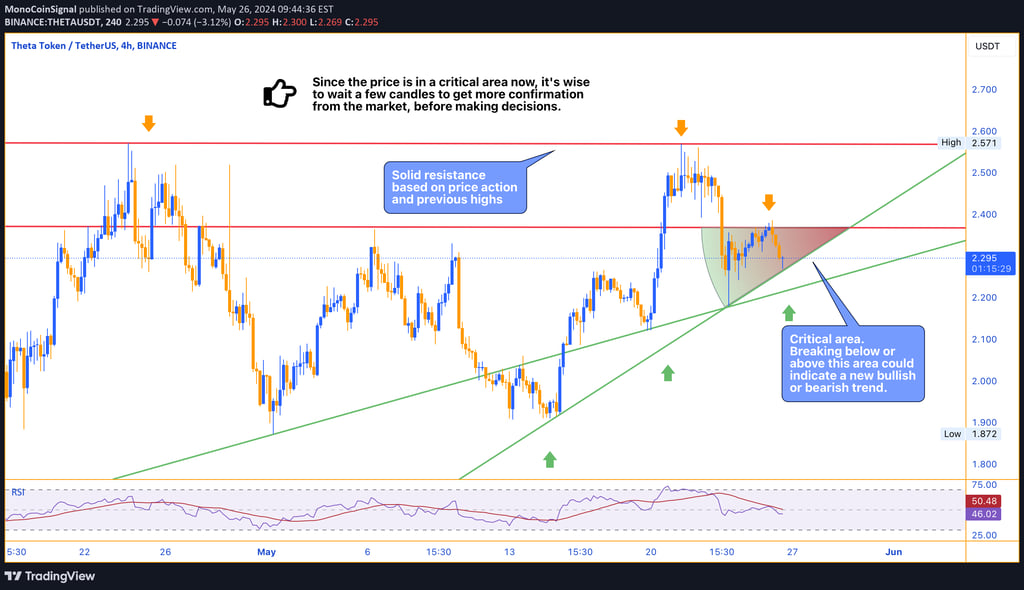
Theta is positioning itself in a critical zone on the 4-hour chart. The market is exhibiting a pattern that suggests potential significant movements based on the next few candlesticks.
It is trading near a solid resistance level around 2.57, a price point marked by previous highs and recent price action. The current area around 2.295 is pivotal. Breaking above or below this level could indicate the start of a new trend, either bullish or bearish.
- Resistance Level: The major resistance at 2.57 is based on historical price action, where the price has previously peaked.
- Support Levels: The ascending trendlines provide dynamic support around the 2.10 and 2.00 levels, with significant support at 1.87.
- RSI (Relative Strength Index): The RSI is currently near the midline (50 level), suggesting a neutral stance. It is important to monitor for potential divergence or confirmation of trend direction based on RSI movements.
Probable Scenario
Given the critical nature of the current price zone, the market sentiment remains cautious. The price is at a decision point, where:
- Bullish Scenario: If the price breaks above the current resistance zone and holds, it could move towards the upper resistance level of 2.57 and potentially higher.
- Bearish Scenario: If the price breaks below the critical support around 2.29, it could test lower support levels around 2.10 and 2.00, with a significant support at 1.87.
Outlook
- Most Probable Scenario: Due to the critical nature of the current price zone, it is wise to wait for more confirmation from the market before making decisions. Observing the next few candlesticks will provide clarity on whether the price will break out upwards or downwards.
Key Levels to Watch:
- Support: 2.29 (immediate), 2.10 (secondary), 2.00 and 1.87 (key)
- Resistance: 2.57 (immediate)