Cracking the Cryptocurrency Code: In-Depth Analysis of Bitcoin, Ethereum, Dogecoin, Tezos, and KAVA in Today's Market
Today's Analysis of Bitcoin, Ethereum, Dogecoin, Tezos, and KAVA: A Comprehensive Cryptocurrency Market Overview
BITCOIN ANALYSISALTCOINS ANALYSISBITCOIN AND ALTCOINS ANALYSIS
5/10/20235 min read
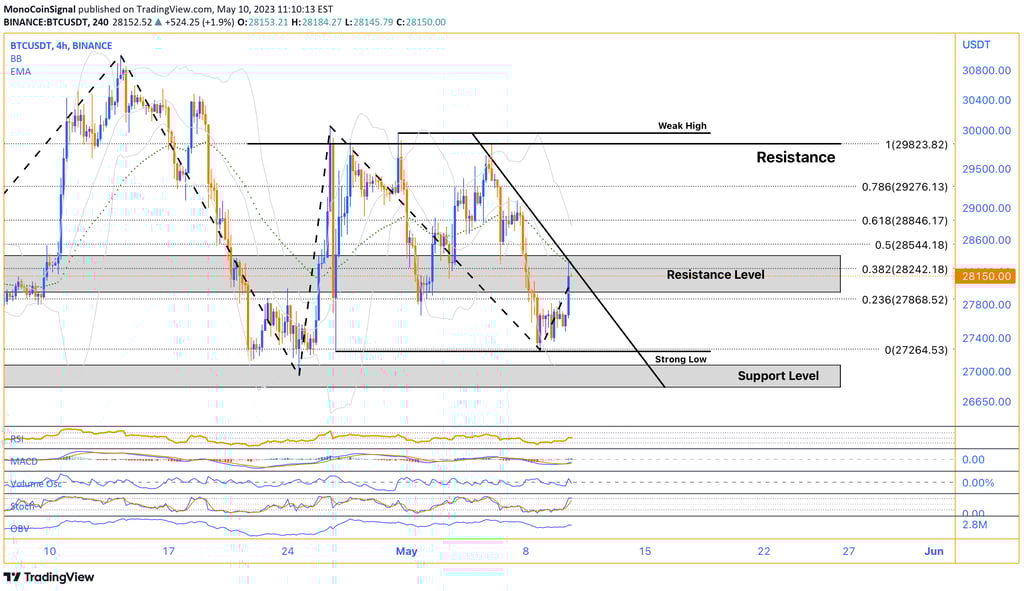
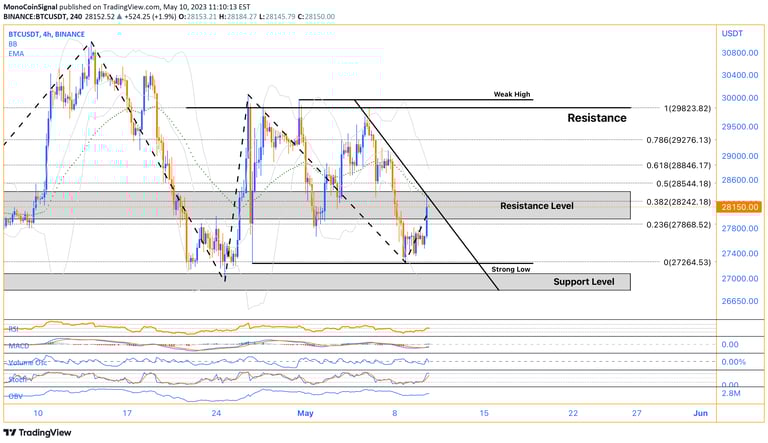
Bitcoin experienced a consistent trend over the past 24 hours, and the lower time frame charts currently provide no clear indicators of an impending trend shift. Consequently, it is advisable to withhold from making any immediate investment decisions until there is a more definitive sign of a change in trend.
However, if the selling pressure intensifies, Bitcoin's value may descend to the support level situated between $27,075 and $26,815. A 'support level' refers to the price level at which demand is thought to be strong enough to prevent the price from falling further. The logic proposes that as the price drops towards support and gets cheaper, buyers become more inclined to buy and sellers become less inclined to sell.
If Bitcoin responds well to this lower support level, it may indicate a potential reversal in the lower time frame, resulting in a pullback. A 'pullback' is a temporary reversal of the current trend, whether it's up or down. It's a term used in technical analysis, referring to a decrease in price following a rally or an increase in price following a decline.
This could subsequently lead to a positive swing for altcoins. Altcoins are all cryptocurrencies other than Bitcoin. Their market behavior is often, but not always, correlated with Bitcoin's. A positive swing for altcoins would imply an increase in their value.
Therefore, closely monitoring the market, particularly the support levels and the potential for a trend reversal, is crucial for sound investment decisions.
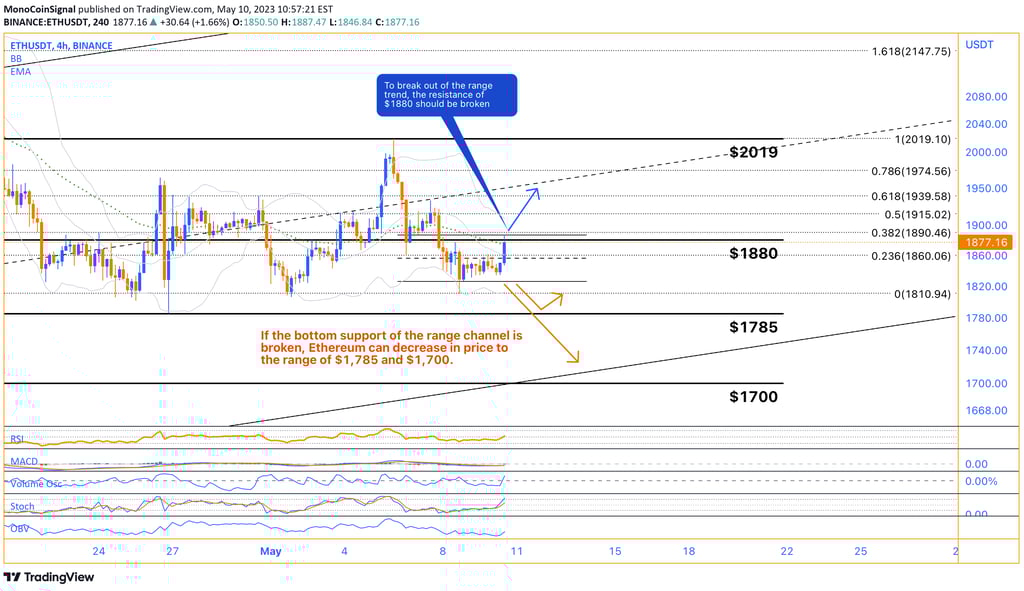
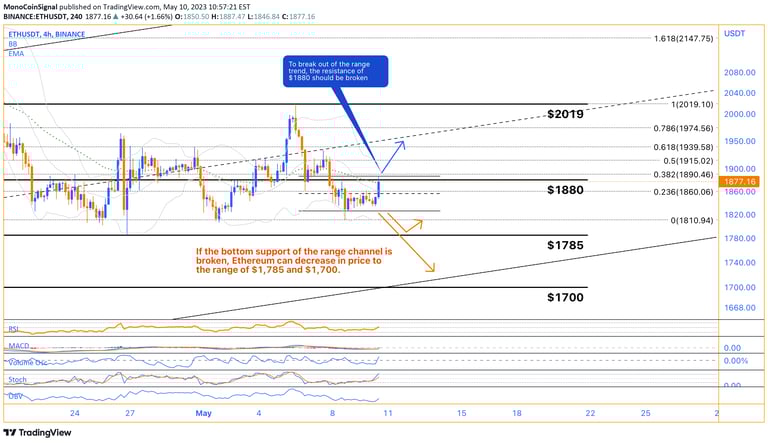
Over the past day, Ethereum has exhibited what we refer to as a 'range trend'. This essentially means that the price of Ethereum has been moving between a set range of values, specifically, between $1850 and $1880. This type of trend is typically characterized by horizontal price movements, which suggest a balance between supply (selling pressure) and demand (buying pressure).
In order for Ethereum to break out of this range trend, it would need to cross the upper resistance level of $1880. Resistance is a concept in technical analysis that determines the price level at which the market may have a difficult time surpassing. If the price manages to break through this resistance level, we could anticipate a shift in Ethereum's trend in both the 4-hour and 1-hour timeframes. This could potentially mean that Ethereum might start to climb, entering into what is known as a bullish trend, where buyers outnumber sellers and drive prices higher.
However, if Ethereum fails to maintain the lower boundary, or floor support, of this range trend, we could see a drop in its price. Support is a level where the price tends to find a floor as buying is strong enough to prevent the price from falling any further. If the support at $1850 is breached, Ethereum's price could potentially drop to somewhere between $1785 and $1700. This would represent a bearish trend, where sellers outnumber buyers and prices decline.
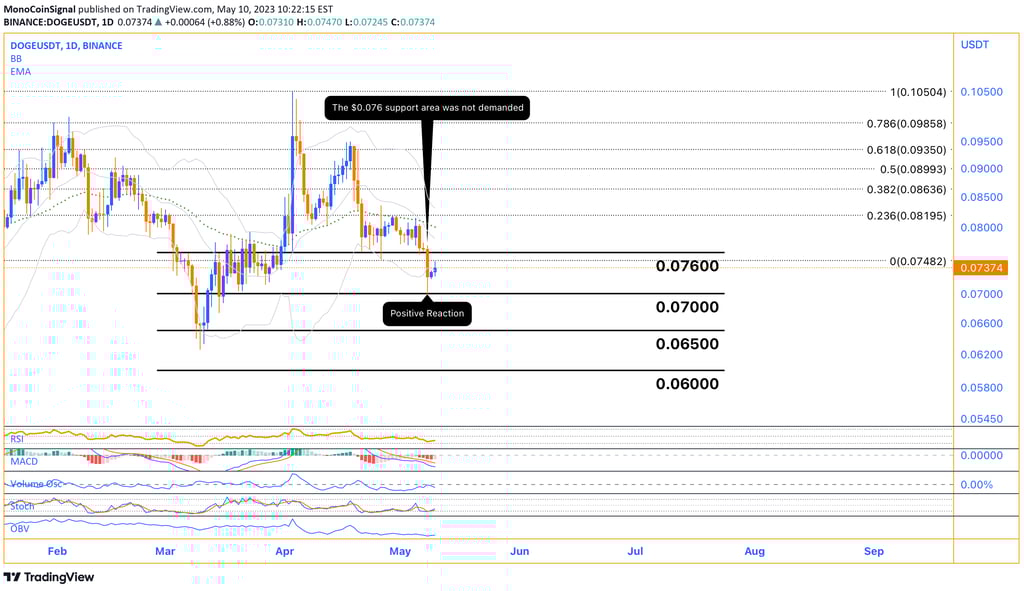

Last week, Dogecoin experienced a significant change in its market dynamics. The support level at $0.076, where demand for Dogecoin typically arises, was not strong enough to withstand the selling pressure. As a result, the price broke this support level below. However, Dogecoin did find some support in the $0.070 range, leading to a modest recovery.
Despite this temporary bounce, the overall trend for Dogecoin remains bearish in the shorter timeframes. Consequently, the price may continue declining toward the $0.065 range. It's important to note that until we observe signs of a trend reversal on the chart, we should not expect the price of Dogecoin to increase significantly.
When examining the 1-hour timeframe, we can observe that the price follows a downward channel. If the support at $0.070 is broken, the price decline may continue toward the $0.065 support range.
Considering the weekly timeframe providing a broader perspective, Dogecoin's most crucial support level is around $0.060. This significant level represents a key support area for the currency over extended periods.
In summary, the recent price action of Dogecoin indicates a bearish trend, with the $0.076 support level being broken. While there was a temporary recovery at the $0.070 range, the currency's overall trend remains bearish in shorter periods. The price may continue to decline toward the $0.065 range. Traders and investors should monitor the price closely and pay attention to the Fibonacci levels and RSI as additional market sentiment indicators.
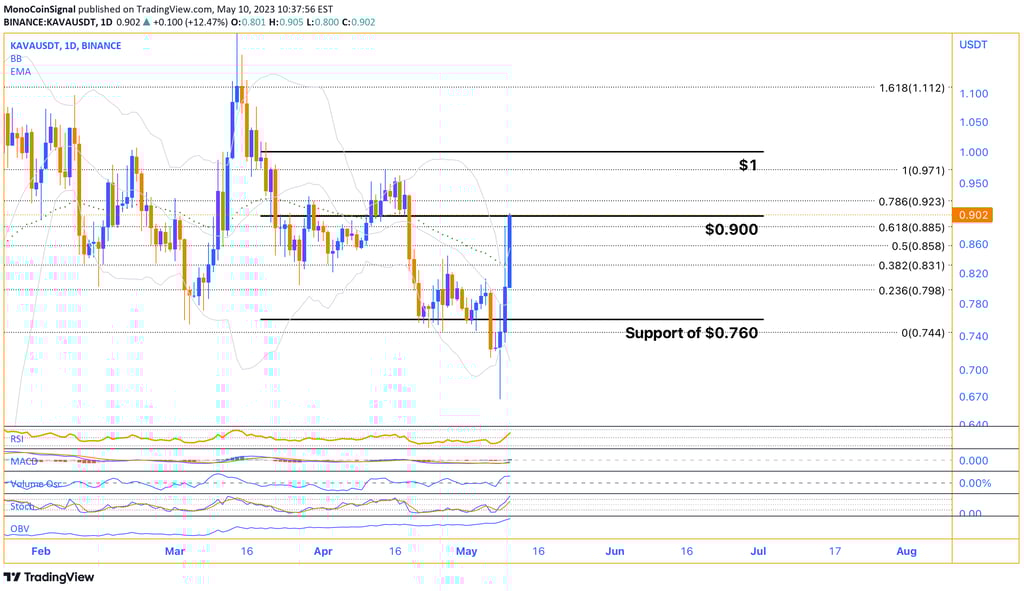
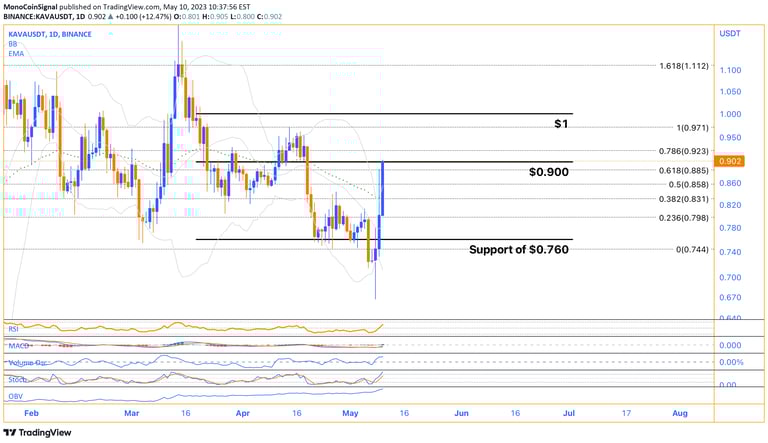
KAVA has been exhibiting an upward trend during the weekly timeframe, resulting in a significant 18% price surge in the past 24 hours. This notable increase can be attributed to the support provided by buyers in the market.
Considering the present market conditions, it is crucial for KAVA to avoid a sudden downward reversal and sustain its support around the $0.760 range. If the currency manages to maintain this support level, there is a possibility of another positive price movement, indicating a potential bullish wave.
In terms of short-term resistance levels, KAVA faces its first significant hurdle around the $0.90 range. If the price manages to surpass this level, it could signal further upward momentum. The second resistance level for KAVA is observed around the $1 mark, serving as another important barrier to monitor.
As investors and traders, it is important to closely observe KAVA's performance, particularly its ability to sustain the current support level and navigate through the resistance levels. These factors will provide valuable insights into the potential future movement of KAVA.
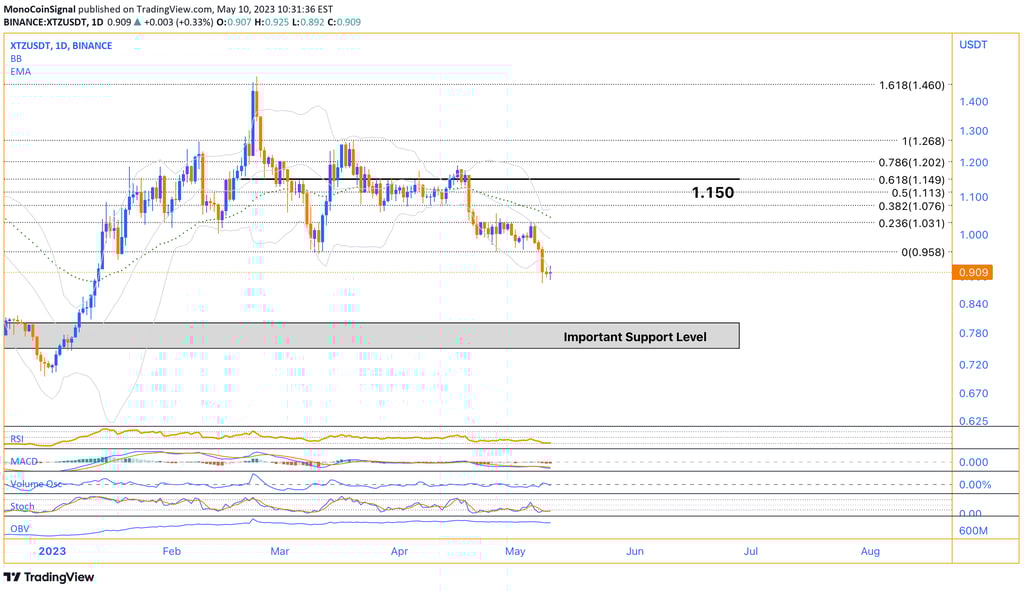
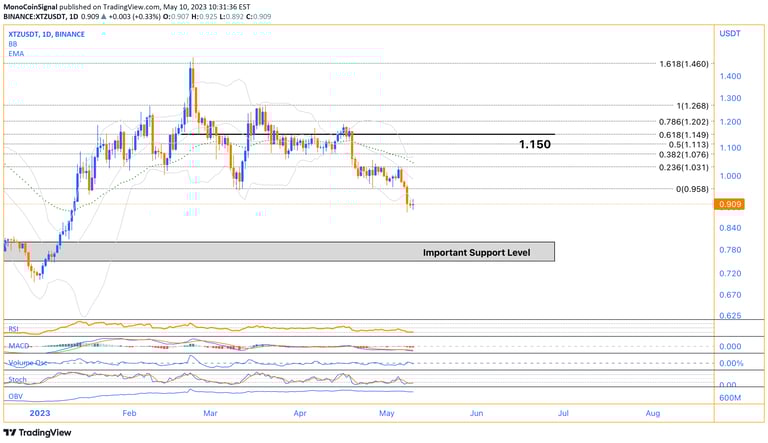
XTZ (Tezos) has been experiencing a downward trend over the past few weeks. Following a decrease in demand around the $1.15 range, the price of XTZ failed to maintain itself above this level. As a result, the currency's value continued to decline, indicating a further drop in the daily timeframe and a potential return to the weekly support level.
It is crucial to highlight the significance of the support range between $0.80 and $0.750 for XTZ. This range has played a significant role in supporting the currency's price. In the current scenario, it can be considered as an important level of support.
Notably, the selling pressure for XTZ remains remarkably high, as evidenced by the bearish candles persisting for four consecutive weeks. However, in the 4-hour timeframe, there is a possibility of witnessing signs of a trend reversal upon reaching this support level. If such indications manifest, we can anticipate growth and positive fluctuations in the price of XTZ.
Therefore, it is important for traders and investors to closely monitor XTZ's performance, paying particular attention to any potential changes in the trend and the behavior of the price at the aforementioned support level.