Consolidation Phase with Neutral Bias
Explore the BAKE token's 4-hour chart, revealing a consolidation phase with a close at 0.4550. Trading within Bollinger Bands and a neutral RSI (55.94) signal balanced market sentiment. Watch for potential support at the current level and resistance at 0.4578. The MACD's bearish crossover suggests short-term caution, providing insights for traders.
3/4/20241 min read
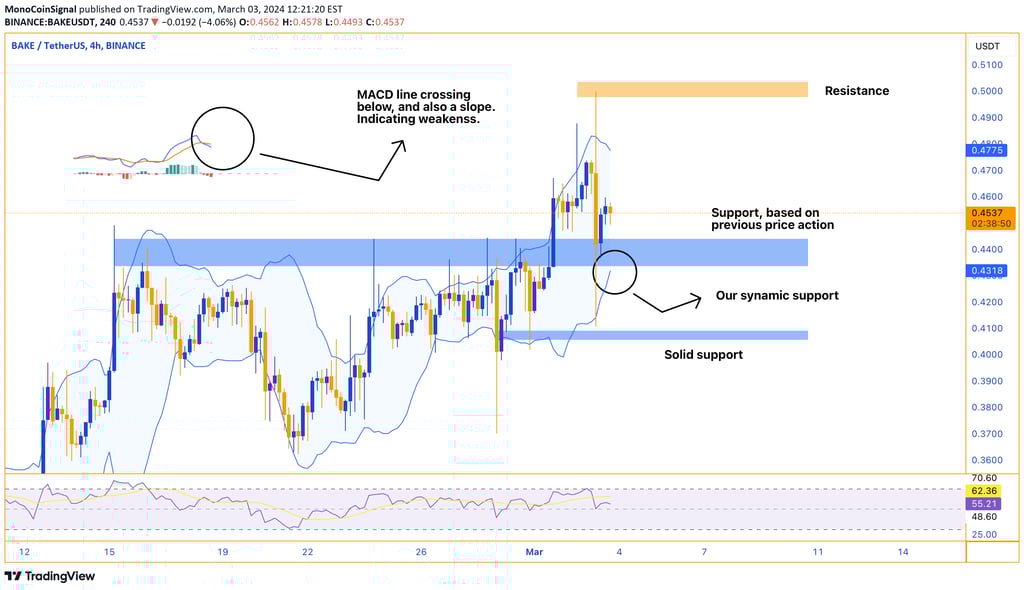
Our technical analysis of the BAKE 4-hour chart indicates a period of consolidation. The price has recently closed at 0.4550, with a trading range defined by a low of 0.4493 and a high of 0.4578. The moderate trading volume of 1.402M does not point to any significant breakout in the immediate term.
From a technical perspective, BAKE is trading within its Bollinger Bands, indicating no extreme volatility. The Relative Strength Index (RSI) is neutral at 55.94, suggesting that neither bulls nor bears are in full control. The Moving Average Convergence Divergence (MACD) shows a slight bearish crossover, with the MACD line just under the signal line, indicating potential short-term weakness.
The chart identifies key support and resistance levels to watch. The current price action is above the solid support level, suggesting that this may hold if a downward move occurs. Conversely, there is a defined resistance level that may cap upward movements. Traders should monitor these levels for potential breakouts or bounces.