Bullish Patterns and Trend Continuation
Understand how price fluctuations within defined ranges, coupled with breakout patterns and support-resistance dynamics, suggest a potential upward trajectory for the asset, with the importance of monitoring key support levels for trend continuation.
4/14/20241 min read
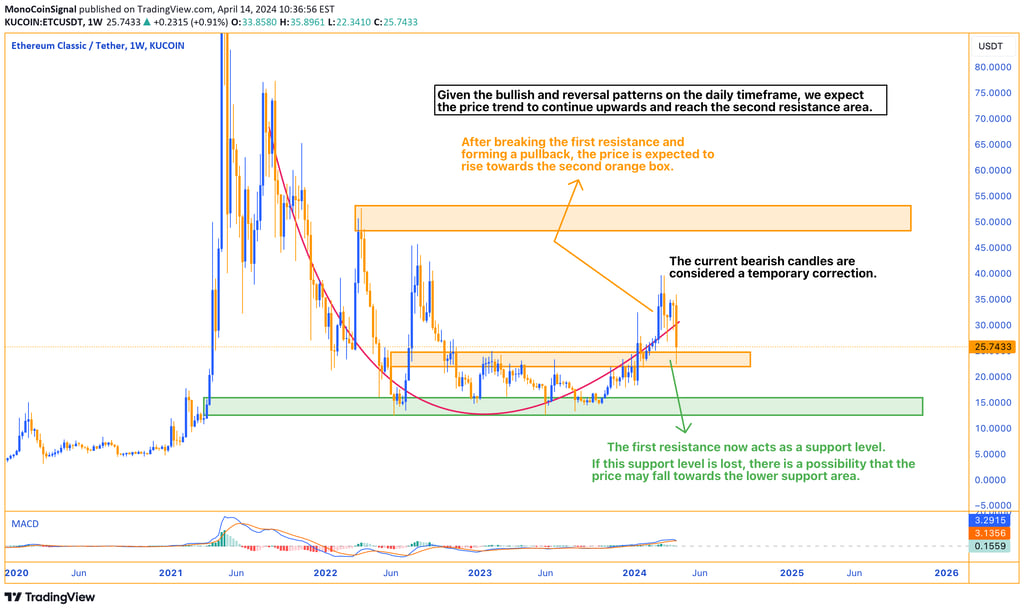
The price initially fluctuated within a specific range between the first support and resistance levels.
After breaking the first resistance and forming a pullback, the price is expected to rise towards the second orange box.
Additionally, the current bearish candles are considered a temporary correction, and given the bullish and reversal patterns on the daily timeframe, we expect the price trend to continue upwards and reach the second resistance area.
Another important point is that the first resistance now acts as a support level. If this support level is lost, there is a possibility that the price may fall towards the lower support area.