Brink of Breakout or Bullish Continuation?
The XRP market, currently trading at $0.6714, stands at a pivotal point on the 4-hour chart. Bollinger Bands suggest a consolidation phase with potential resistance testing, while the Ichimoku Cloud supports the bullish trend. SMA and Parabolic SAR favor buyers, but caution is warranted with ADX and Stochastic signals. Steady volume, CMF around zero, and MACD convergence hint at a balanced market. Likely scenario: Short-term consolidation with potential breakout or reversal based on key technical levels.
11/12/20232 min read

As the XRP market moves through the digital asset landscape, the XRP trading pair currently trades at $0.6714, presenting a crucial junction at the cusp of a potential volatility expansion. The 4-hour chart on Binance reveals a symphony of technical indicators that, when combined, provide a nuanced picture of the market's current state.
The Bollinger Bands, which have been a reliable measure of market volatility, are starting to narrow slightly, indicating a consolidation phase is in place. The current price hovers near the upper band, hinting at a test of resistance. Concurrently, the Ichimoku Cloud paints a bullish backdrop, with the price action comfortably positioned above the cloud, suggesting that the bullish trend remains intact despite recent price consolidation.
Complementing the bullish sentiment is the position above the Simple Moving Average (SMA), reinforcing the notion that buyers still have the upper hand. The Parabolic SAR dots trail below the price action, providing further bullish confirmation. However, the Average Directional Index (ADX) and the Stochastic Oscillator relay a message of caution; although the trend's strength is moderate, the lack of momentum indicated by the Stochastic Oscillator suggests that the market is in a phase of indecision.
Volume and On Balance Volume (OBV) have maintained steady levels, indicating an ongoing commitment from traders, while the Chaikin Money Flow (CMF) hovers around the zero line, showcasing a balanced market where neither buyers nor sellers have definitive control. The Moving Average Convergence Divergence (MACD) exhibits a convergence with its signal line, depicting a market that could be on the verge of a momentum shift.
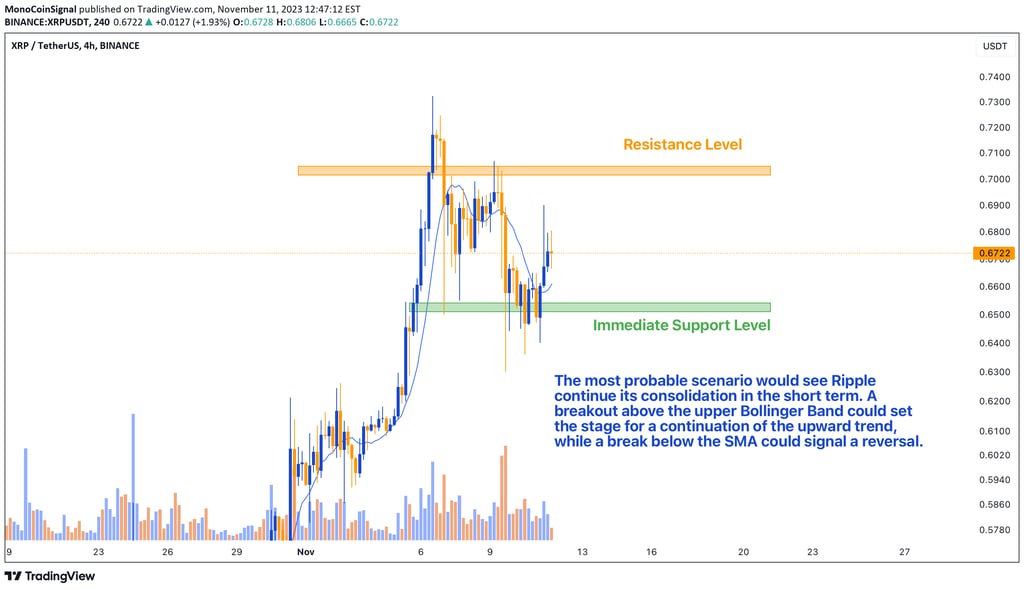
Most Probable Scenario:
Taking into account the confluence of these indicators, the most probable scenario would see XRP continue its consolidation in the short term. A breakout above the upper Bollinger Band could set the stage for a continuation of the upward trend, while a break below the SMA could signal a reversal.
Conclusion:
In summary, XRP is showcasing a battle between consolidation and continuation, with indicators slightly favoring the bulls. Traders should keep a close eye on the aforementioned support and resistance levels, which will likely dictate the direction of the next significant price move. It's crucial to stay updated on market developments, as the technical landscape can shift rapidly.