BOND Momentum Analysis
Dive into a comprehensive analysis of BOND's strong upward momentum, supported by various technical indicators. We evaluate the potential for a continuation of this bullish trend and highlight the importance of monitoring overbought conditions and key support/resistance levels for informed trading decisions.
10/14/20231 min read
BOND displays signs of strong upward momentum. After analyzing the indicators and chart patterns, we can glean insights about potential future price action and key levels to monitor.
Indicators and Analysis:
The price action has breached the upper Bollinger Band. This typically suggests overextension in the short term, and the asset might be due for a pullback or consolidation. However, this can also be a sign of strong momentum if supported by other bullish indicators.
Without a clear view of the Ichimoku Cloud, it's hard to provide a precise analysis. However, the Ichimoku Cloud can give insights into future support and resistance levels, so keeping an eye on any potential cloud crossovers will be crucial.
With %K at 64.34 and %D at 71.64, the asset exhibits bullish momentum. However, it's nearing potential overbought conditions, suggesting caution.
Approaching the overbought territory, the RSI at 66.50 indicates strong buying interest, but traders should be cautious of potential reversals if it surpasses 70.
The rising OBV suggests that volume is supporting the bullish price action, indicating strength in the move.
Most Probable Scenario:
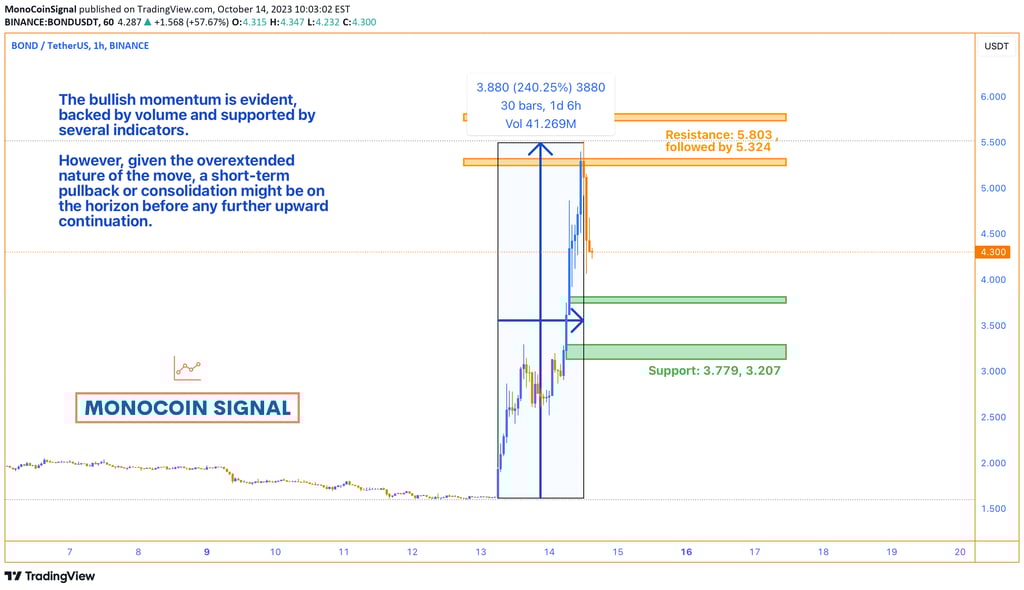
The bullish momentum is evident, backed by volume and supported by several indicators. However, given the overextended nature of the move, a short-term pullback or consolidation might be on the horizon before any further upward continuation.
Conclusion:
It seems bullish in the short term, but traders should be cautious of potential overbought conditions. Monitoring the mentioned key levels and setting stop-losses appropriately is advised.