Bitcoin's back to the price you asked for.
BTC Analysis.
BITCOIN ANALYSIS
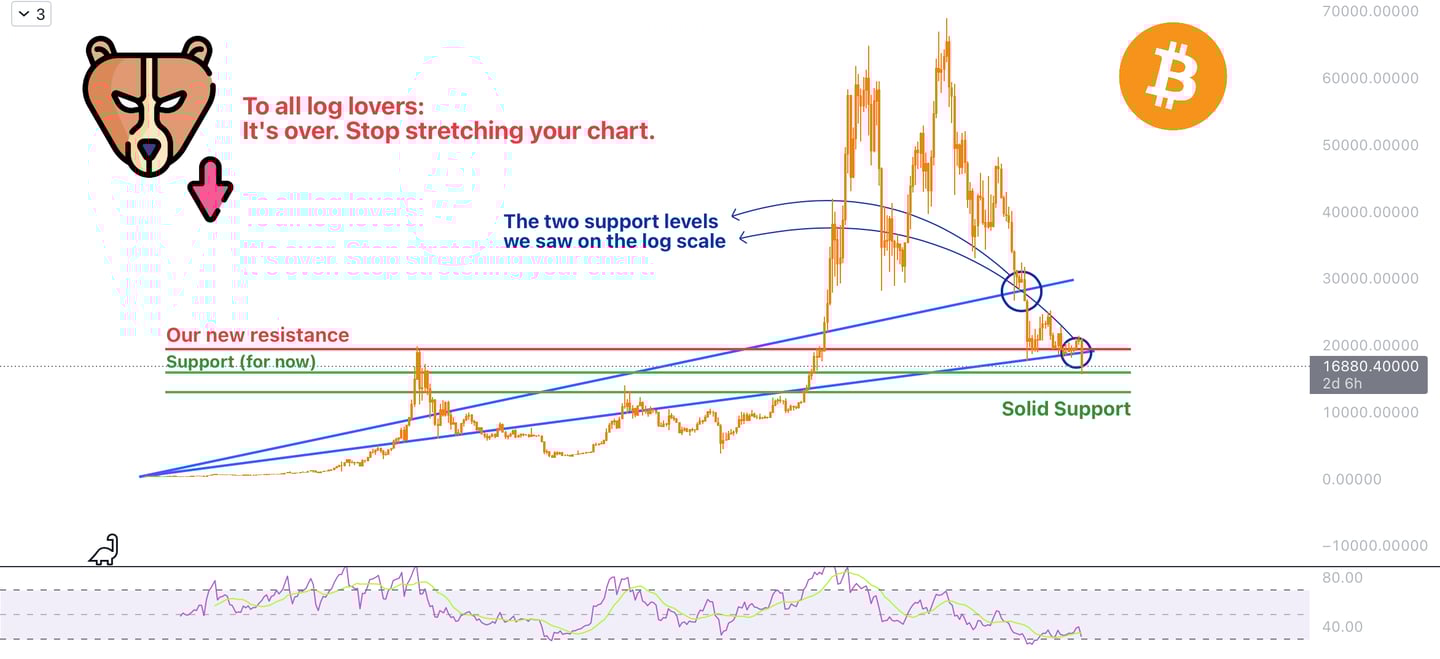
The last time we did a Bitcoin analysis, it was about Bitcoin's chart with the log scale.
We showed two dynamic supports which could hold the price up, but now they're both out of the picture.
Now, all we have is our static resistance around the 19K area, which is being activated in 2-3 days after we close a weekly candle below that level.
Also, we have two support levels. One is the local support of around 16K, and the other is about 13K.
That 100K Bitcoin is more of a myth right now, to be honest.
The whole news about FTX and the crash of FTT, SOL, and USDT... caused this. And for sure, it was programmed.
Now let's see your ideas. Let's have a discussion.
Let me know if you guys have any questions;
I will be more than happy to help.
Good luck, and thank you.
If you want access to the best analysis and receive the best crypto signals, join MonoCoin Signal.
You can access futures signals, spot signals, and forex signals.
Visit www.monocoin.net and get a subscription today.
MonoCoin Signal sends trading signals every day.