Bitcoin Trading Range
Bitcoin's four-hour analysis reveals fluctuation within defined ranges, with $42,800 as key support and $44,700-$44,500 as resistance. Breakouts from these levels can signal trend changes, offering trading opportunities. Bitcoin dominance, trending bearish, faces key support at 53, with potential for further decline until a Market Trend Reversal (MTR) signals a trend shift.
12/10/20231 min read
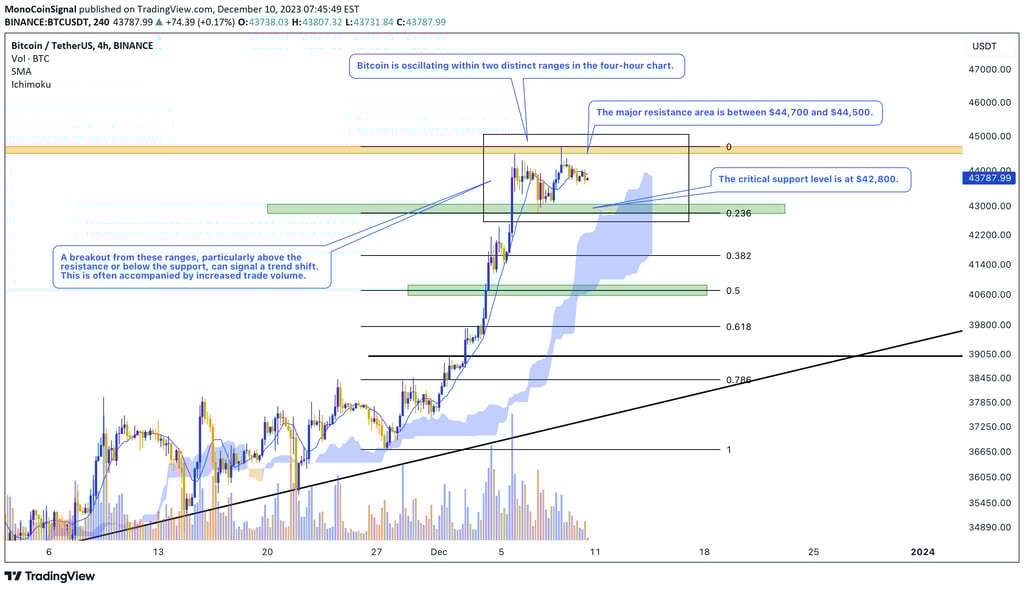
In the four-hour technical analysis of Bitcoin, it's observed that the price is fluctuating within two defined trading ranges. The lower boundary of these ranges is around $42,800, serving as a key support level.
Conversely, the main resistance is identified in the range of $44,700 to $44,500. Analyzing the price reactions in these pre-determined areas can lead to a better understanding of market trends.
To determine Bitcoin's exit from these trading ranges, we should look for a price breakout from the resistance or support levels.
This breakout could indicate a trend change and is often accompanied by an increase in trading volume and buying pressure.
Particularly, a pullback after the breakout can provide favorable trading opportunities, and the breakout is expected to confirm the continuation of an upward or downward trend.