Bitcoin: Resistance Test and Key Support Insight
Bitcoin's recent ascent towards the 4-Day chart's 0 Fibonacci retracement level presents an optimistic outlook, with resistance at $50,879. A break above this level could signal a push towards the 1.618 Fibonacci extension, indicating a robust continuation of the upward trend. The daily chart, with the price at the upper Bollinger Band, suggests potential overbought conditions, possibly leading to a retracement or sideways movement. The lower Bollinger Band indicates a significant support zone around $39,152.80. MACD histogram at 670.46 reflects strong bullish momentum, but traders should watch for signs of reversal, especially if the histogram shrinks. Substantial volume at 17.83K BTC adds credibility to recent price movements. While bullish momentum is evident, traders should be cautious of overbought conditions and consider support zones such as the lower band and the SMA at 49,937.20 for potential entries on dips. Vigilance on volume fluctuations and MACD signals is advised for early trend change indications.
2/17/20241 min read
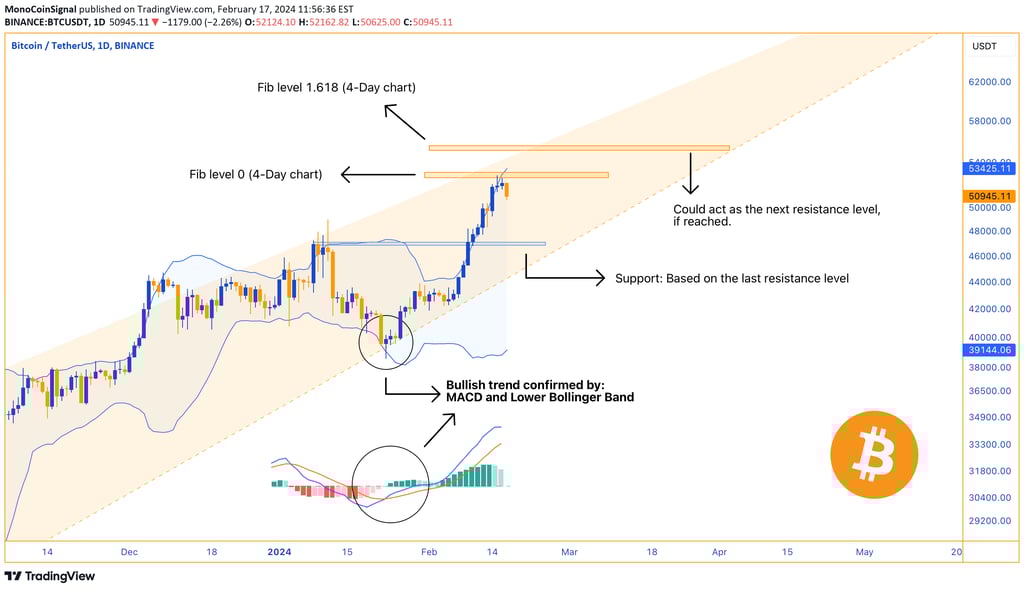
Bitcoin's recent market activity has painted an optimistic picture as it ascends towards the 4-Day chart's 0 Fibonacci retracement level. However, it's currently facing resistance at this pivotal mark, with the price hovering around $50,879. This level is critical; a convincing break above could pave the way for a push towards the 1.618 Fibonacci extension level, indicating a robust continuation of the upward trend.
The daily chart reveals the price nestled at the upper Bollinger Band, typically a sign that the market could perceive Bitcoin as overbought, which often precedes a retracement or sideways movement. Such a pullback would not be out of character for Bitcoin's volatile nature, especially after a strong upward move. The Bollinger Bands also provide a visual representation of the volatility and potential support levels, with the lower band suggesting a significant support zone around $39,152.80, which aligns with historical resistance now turned support.
Fundamental indicators add depth to this view, with the MACD histogram at 670.46, showing strong bullish momentum, but also warranting caution for any signs of reversal which could be preempted by a shrinking histogram. The substantial volume of 17.83K BTC indicates a serious commitment behind the recent price movements, lending credibility to the current levels.
In sum, while the bullish momentum for Bitcoin is clear, traders should watch for consolidation or a slight pullback due to the overbought conditions suggested by the proximity to the upper Bollinger Band. The lower band and the SMA at 49,937.20 offer support zones that could be of interest for those looking to enter on dips. A vigilant eye should be kept on volume fluctuations and the MACD for early signs of trend changes as Bitcoin tests these crucial levels.