Bitcoin - Price Update
Stay updated on Bitcoin's price action! Bitcoin broke out of its descending trendline and formed a head and shoulders pattern, signaling a potential trend reversal. Key resistance at $67,000 and support at the ascending trendline. Read more for detailed analysis.
5/23/20241 min read
Hello Traders! Here’s a quick update on Bitcoin’s price action:
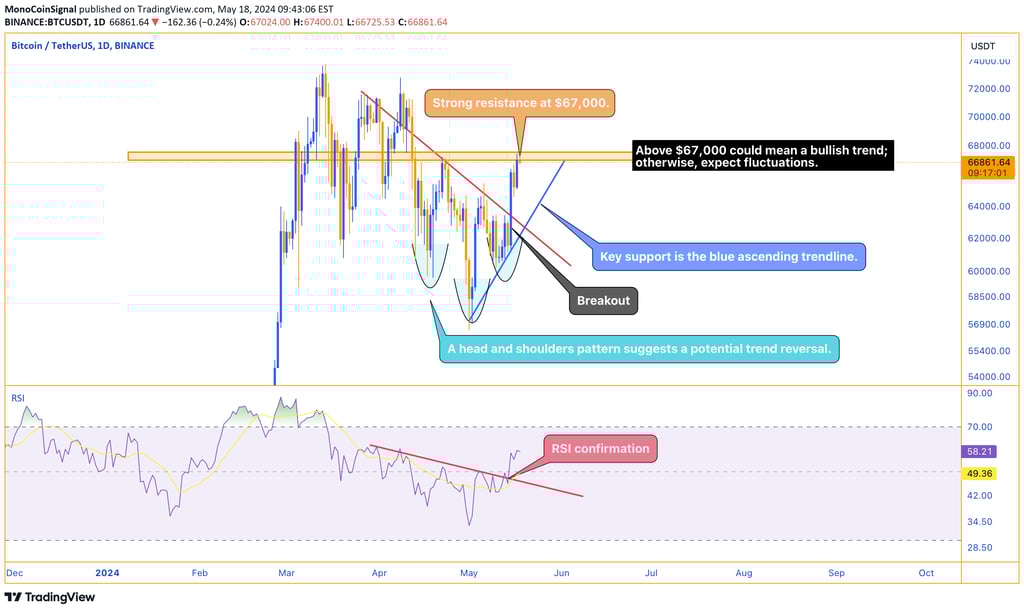
Bitcoin broke out of its descending trendline last Wednesday, also confirmed by the RSI.
A head and shoulders pattern has formed, indicating a potential trend reversal.
Bitcoin faces strong resistance at $67,000. Breaking this level could signal a continued bullish trend. The key support is the ascending trendline in blue.
Breaking and sustaining above $67,000 could lead to a stronger bullish trend. Otherwise, expect fluctuations within the current range.