Bearish Trend and Key Levels
Bitcoin dominance on a 4-hour chart shows a bearish trend, testing key support at 53. While it has responded to this level, the overall trend remains downward. A potential trend reversal, marked by a Market Trend Reversal (MTR) and reclaiming previous highs, could signal an end to the bearish phase. Until then, further decline in Bitcoin dominance is likely.
12/10/20231 min read

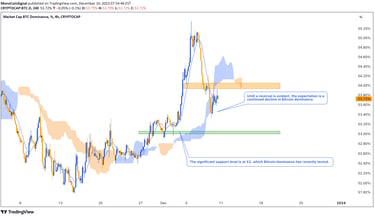
Observing Bitcoin dominance on a 4-hour timeframe, we are witnessing a bearish trend. The next key support level to consider is 53.
Bitcoin dominance has so far reacted to this level, but the overall trend seems to be downward. A trend reversal, indicated by a Market Trend Reversal (MTR) - marked by reclaiming its previous high - would signal the end of the bearish trend.
However, until we see such a change, a further decline in Bitcoin dominance is more probable.