attempting to break the bottom of the channel
TIA is currently ranging within a horizontal channel, showing equal highs and lows. It is attempting to break the channel's bottom, with potential for further downward movement after a complete pullback.
6/10/20241 min read
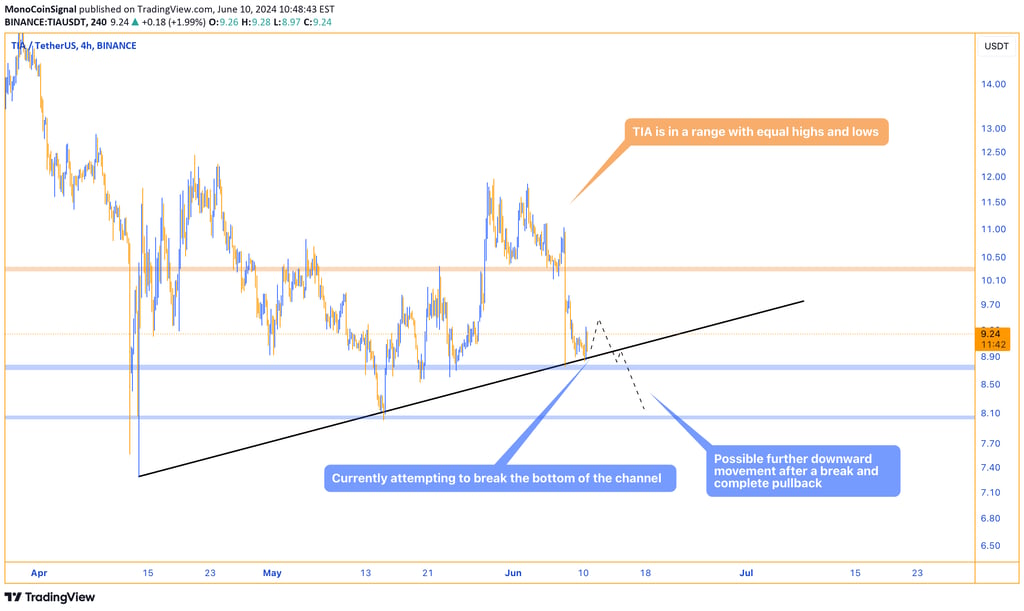
TIA is currently ranging, with equal highs and lows and showing good fluctuations. It is within a horizontal channel, oscillating between the top and bottom of the channel. Currently, it is trying to break the bottom of the channel. The expected scenario is that it might break the bottom and, after a complete pullback, there could be potential for further downward movement.