Attempting a breakout
The trend of MEME token is ranging on higher time frames but bearish on lower time frames. The price is attempting to break a descending trendline that has previously pushed it down twice. Close observation is crucial to see if this breakout will succeed.
6/8/20241 min read
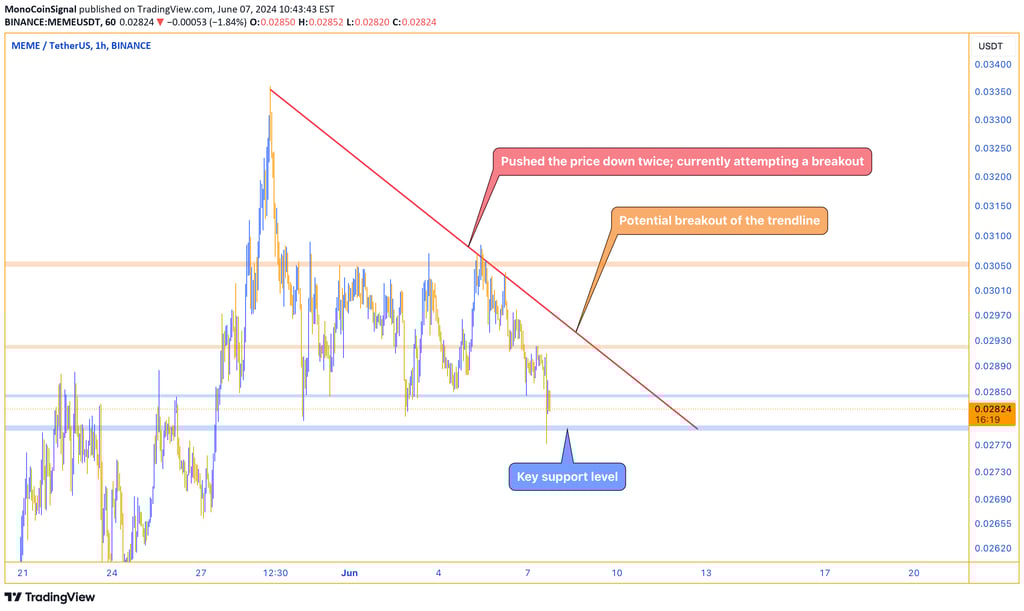

The trend of MEME is ranging on higher time frames and bearish on lower time frames. There is a descending trendline that has pushed the price down twice, and now it is trying to break this trendline.