Ascending Trendline
Helium (HNT) maintains its upward trajectory above the ascending trendline in the daily timeframe, with the next target set at the Fibonacci level 1 area, supported by the trendline.
3/14/20241 min read
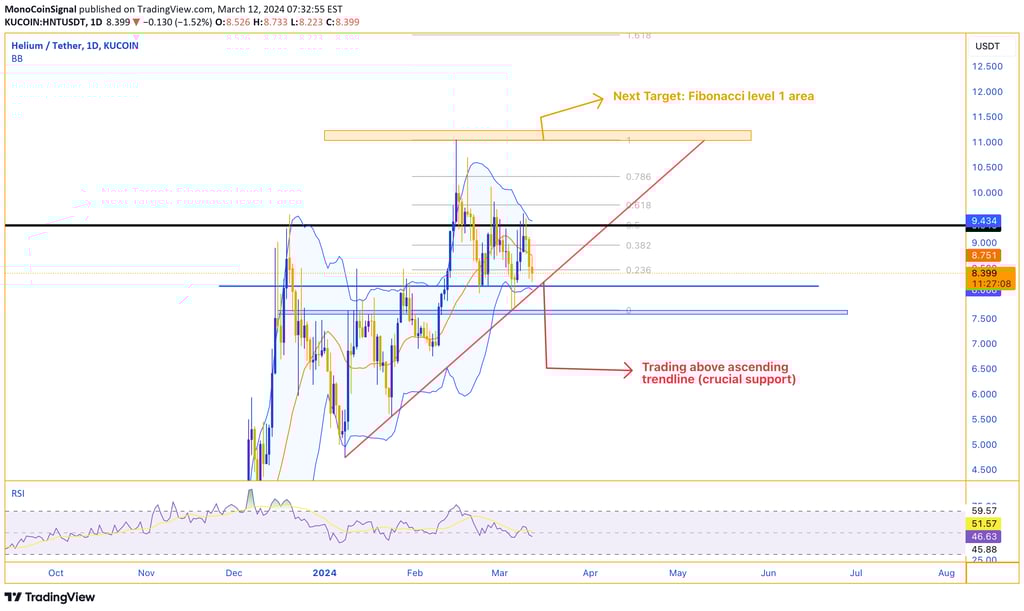
In the daily timeframe, Helium continues to trade above its ascending trend line, which acts as a crucial support level for it. If it supported by its trendline, the next target will be the Fibonacci level 1 area, which is marked with an orange box.