Ascending Trendline
Dive into the 4-hour timeframe analysis of Ethereum, revealing a bullish trend with a triangular pattern breakout. Orange resistance areas indicate potential price targets, emphasizing the importance of maintaining the ascending trend line for sustained upward momentum.
3/10/20241 min read
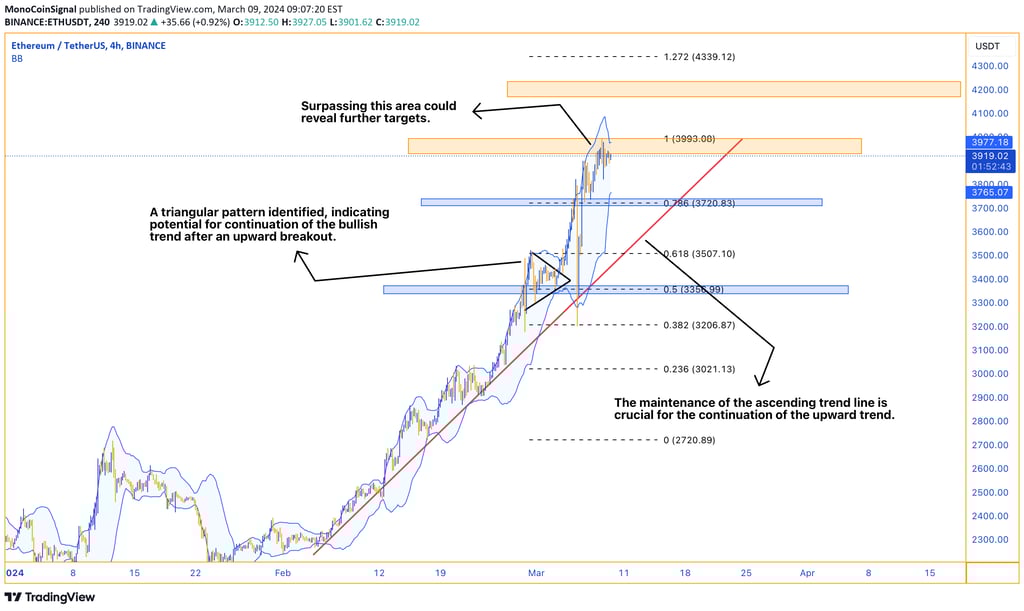
On the 4-hour timeframe, it is observed that the overall price trend is bullish, confirmed by drawing an ascending trend line. Upon a closer examination of the chart, a triangular pattern formation is noticed, indicating a continuation of the bullish trend after the upper side of the pattern breaks upwards. This breakout represents a key point in technical analysis, and subsequent price targets based on this movement are marked on the chart with orange resistance area. Reaching the third price target indicates a high potential for continued upward movement, and if the price can surpass this area, further price targets become visible on the horizon. Maintaining the ascending trend line is considered crucial for the continuation of the bullish trend, hence as long as this trend line is preserved, the price of Ethereum is expected to reach higher levels.