AGLD Analysis
Explore the comprehensive analysis of Adventure Gold (AGLD), recently listed on Binance. Assess its bullish momentum indicated by technical markers like the SMA and MACD, juxtaposed with a high RSI signaling caution. Gain insights into potential future movements and strategic trading points.
10/22/20231 min read
Adventure Gold (AGLD) has recently been listed on Binance, adding significant trading volume and exposure for the token. In today's analysis, we will be reviewing its recent price action, technical indicators, and other pertinent information.
Technical Analysis:
Price Movement and Volume: The AGLD/USDT pairing on Binance currently trades at 0.721 USDT, marking a notable 17% price change over the past 24 hours. This sudden movement is accompanied by a trading volume of 25.183M, signaling strong trader interest.
Fibonacci Retracement Levels: Observing the Fibonacci retracement levels, AGLD seems to be oscillating near the 0.618 retracement level, which is typically a significant support or resistance zone. The price at this level is approximately 0.726, closely aligning with the current price.
Moving Averages and Ichimoku Cloud: The Simple Moving Average (SMA) sits at 0.582, with the price trading above it, indicating bullish momentum. Moreover, the Ichimoku Cloud appears to support this bullish sentiment.
RSI and MACD: The Relative Strength Index (RSI) is at 69.04, which is near the overbought territory, suggesting caution. The MACD histogram is positive, with the MACD line slightly above its signal line, further indicating bullish momentum.
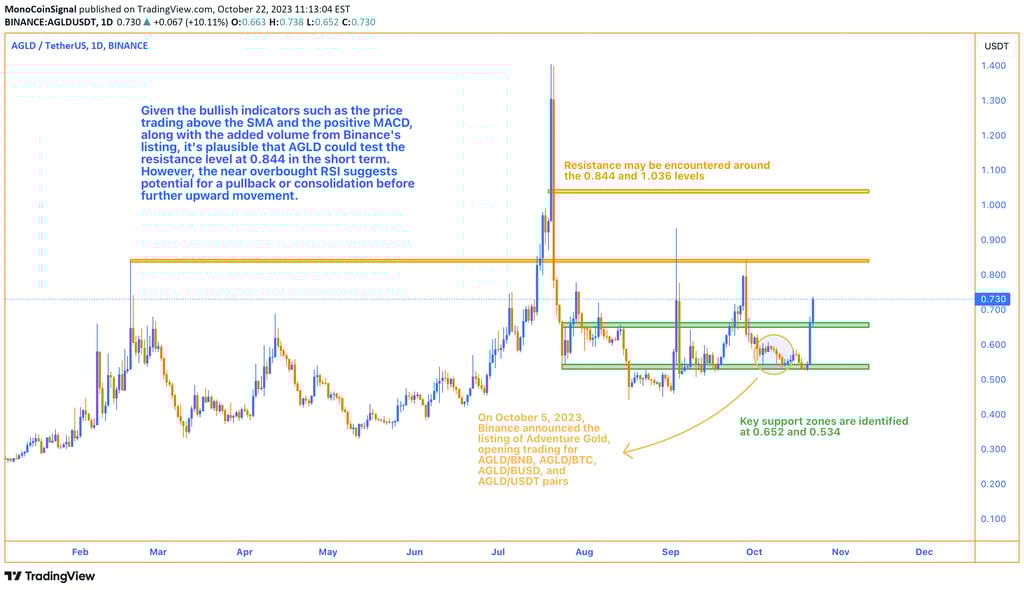
Support and Resistance: Based on recent price action and the Fibonacci retracement levels, key support zones are identified at 0.652 and 0.534, while resistance may be encountered around the 0.844 and 1.036 levels.
Most Probable Scenario:
Given the bullish indicators such as the price trading above the SMA and the positive MACD, along with the added volume from Binance's listing, it's plausible that AGLD could test the resistance level at 0.844 in the short term. However, the near overbought RSI suggests potential for a pullback or consolidation before further upward movement.
Conclusion:
Adventure Gold's recent listing on Binance has added both liquidity and volatility. The current technical analysis leans bullish, but traders should be cautious given the elevated RSI. It's essential to monitor the key support and resistance zones mentioned and adjust trading strategies accordingly. Always utilize stop-loss orders to protect your investments and trade responsibly.